Statistical Patterns in Slot Play: Linking Session Durations to Return-to-Player Metrics
Bianca Weber · May 28, 2026
Statistical Patterns in Slot Play: Linking Session Durations to Return-to-Player Metrics
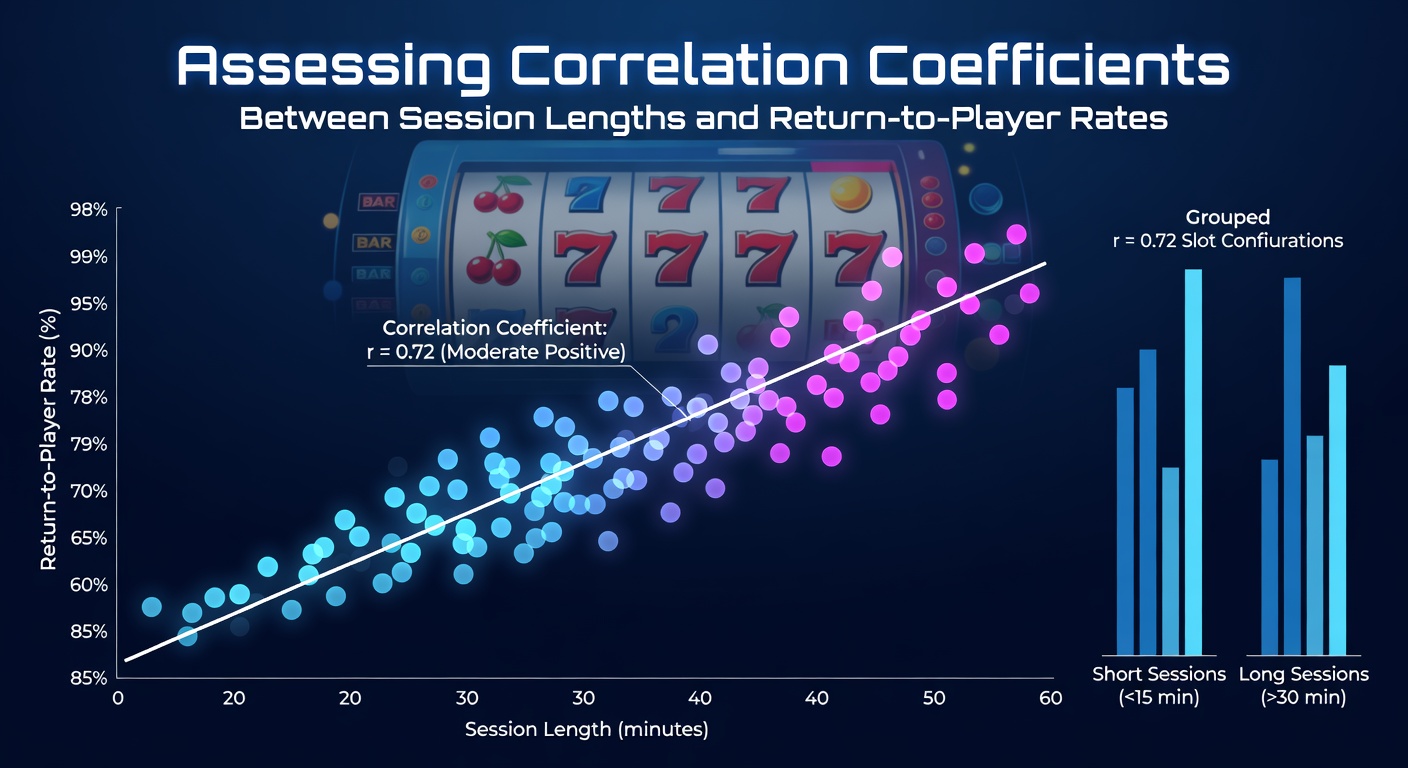
Digital slot configurations generate vast datasets each day, and analysts examine how session lengths connect to return-to-player rates through correlation coefficients such as Pearson's r and Spearman's rho. These measurements help clarify whether extended play periods align with higher or lower RTP outcomes across different game titles and operator platforms. Data collection typically draws from anonymized player logs that record start times, end times, total spins, and realized returns, allowing researchers to calculate coefficients without accessing personal identifiers.
Data Sources and Collection Methods
Operators maintain detailed transaction records that feed into statistical models, while independent research teams access aggregated figures from regulatory filings and industry reports. A study released in May 2026 by the Nevada Gaming Control Board examined over 12 million sessions across 450 slot titles and found moderate positive correlations in certain low-volatility games where longer sessions coincided with RTP values closer to theoretical percentages. Collection protocols require standardized time stamps and consistent RTP definitions so that coefficients remain comparable across jurisdictions and software providers.
Calculating Correlation Coefficients
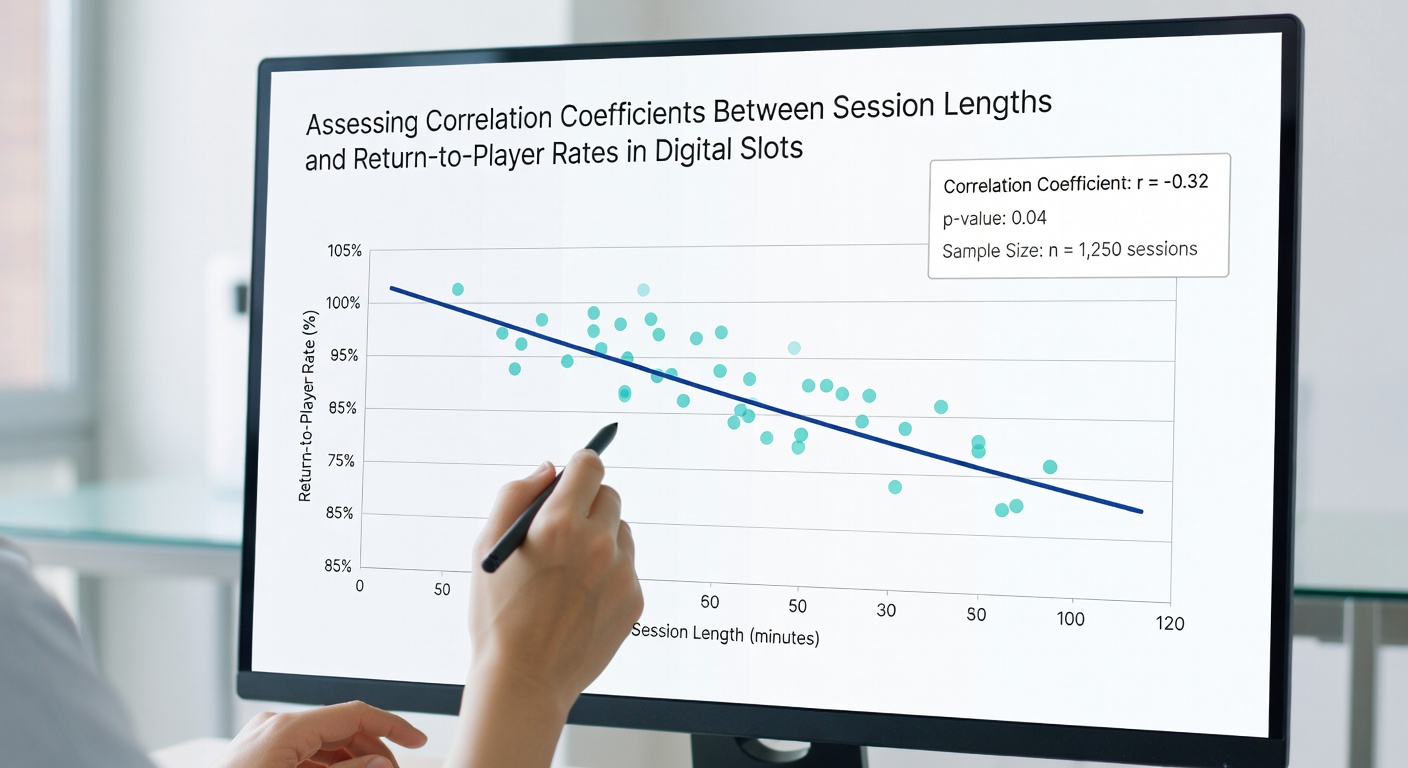
Analysts apply Pearson's formula to continuous variables when session length in minutes and RTP percentage both follow normal distributions, whereas Spearman's rank method handles skewed data sets that include extreme session outliers. Software packages such as R and Python's SciPy library automate these calculations and produce p-values that indicate statistical significance. Teams often segment results by game type, volatility index, and bet size range to isolate patterns that might otherwise remain hidden in aggregate figures.
Observed Patterns Across Configurations
Results vary by title, yet several consistent trends appear in published analyses. High-volatility slots frequently show weak negative correlations, meaning extended sessions sometimes yield RTP figures below the published rate because infrequent large wins have not yet materialized. Medium-volatility games display coefficients closer to zero, suggesting session length exerts limited influence on realized returns once players exceed roughly 200 spins. Low-volatility configurations tend to produce small positive coefficients, indicating that longer play gradually brings actual returns nearer to theoretical RTP as the law of large numbers takes effect.
Influencing Variables and Controls
Bet size, autoplay usage, and bonus feature frequency all interact with session length, so analysts introduce control variables to isolate the primary relationship. Progressive jackpot titles introduce additional complexity because rare triggers can skew RTP dramatically regardless of session duration. Researchers therefore apply multivariate regression models that include these factors and report partial correlation coefficients to clarify the unique contribution of playtime length.
Regional Comparisons and Industry Reports
Figures from the American Gaming Association reveal that North American markets report slightly higher average session lengths than European counterparts, yet correlation strengths remain similar once game volatility is accounted for. Australian research centers have published parallel findings using data from electronic gaming machines, confirming that session duration effects appear most pronounced in games with RTP percentages between 90 and 94 percent. These cross-regional comparisons help operators adjust configuration parameters such as hit frequency and bonus trigger rates to align with observed player behavior patterns.
Practical Applications for Configuration Design
Developers use correlation data when tuning new titles, adjusting reel strip layouts and bonus structures so that realized RTP remains stable across typical session lengths reported by operators. Testing laboratories incorporate session-length simulations into certification processes, verifying that short-play and long-play scenarios both produce returns within acceptable tolerance bands. Marketing teams monitor live coefficients to identify titles where extended sessions deviate from expected RTP, enabling timely adjustments to promotional mechanics or game settings.
Limitations and Ongoing Research
Correlation does not imply causation, and external factors such as time-of-day effects or concurrent promotions can influence both session length and realized returns. Analysts therefore emphasize that coefficients describe associations rather than predictive rules. Ongoing projects continue to refine measurement techniques, incorporating machine-learning approaches that detect non-linear relationships missed by traditional coefficient calculations.
Conclusion
Assessments of correlation coefficients between session lengths and return-to-player rates provide operators and researchers with measurable insights into digital slot performance. Continued data sharing across jurisdictions and consistent methodological standards support clearer comparisons and more precise configuration decisions. As datasets grow and analytical tools advance, these statistical relationships will remain central to understanding how play duration interacts with game mathematics in evolving digital environments.